Hormel Foods Dividend Stock Analysis (HRL)

Hormel Foods Dividend
(updated 6/16/2017)
The Hormel Foods dividend has been paid every year since 1928 and increased for 51 consecutive years; qualifying the company as a Dividend King, Dividend Aristocrat, and Dividend Champion.
Price: $33.95
Current Dividend: $0.68
Dividend Yield: 2.0%
Cash Dividend Payout Ratio: 52%
Market Capitalization: 18 B
Enterprise Value: 18 B
Description
Sector: Consumer Defensive
Industry: Packaged Foods
Hormel Foods (HRL) is engaged in the manufacture and marketing of meat and food products in the United States (94%) and internationally. The company has a balanced business model which reports in five business segments: Grocery Products, Jennie-O Turkey Store, Specialty Foods, Refrigerated Foods, and International & Other.
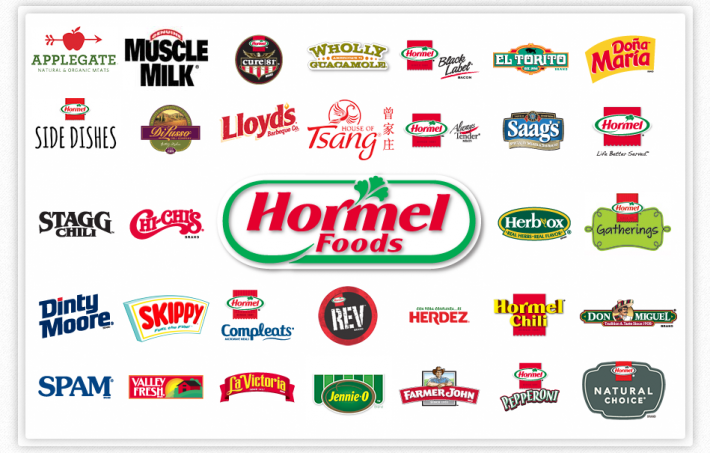
Hormel brands include Hormel Chili, Dinty Moore stews, SPAM, Valley Fresh chunk chicken, Hormel Compleats meals, Stagg chili, Wholly Guacamole, SKIPPY peanut butter, Hormel Black Label bacon, Lloyd’s barbecue products, Hormel party trays, Hormel Natural Choice meats, Farmer John products, and Jennie-O Turkey products.
In 2015 Hormel purchased Applegate Farms. This provides the company a high growth brand in the natural and organic products category. Applegate is the #1 brand in organic and natural prepared meats.

SWOT Analysis
Strengths
Hormel Foods has the management expertise and balance sheet to grow the company organically and through acquisitions. The company has built a portfolio of strong brands in a mixture of segments.
The increasing demand for protein rich foods means Hormel Foods is on the right side of a powerful trend. Its strong brands, size, and expertise provides the company competitive advantages that create at least a narrow moat going forward.
Weaknesses
Hormel Foods still has many center of the store products where competition is tough. This means overall margins are less than the value-added products the company has been adding to its product portfolio.
Opportunities
The biggest opportunity of Hormel Foods is international growth. The company is expanding its reach by marketing its popular brands in other countries including: Canada, Australia, Mexico, Japan, and England.
The growing natural and organic trends provides Hormel Foods the opportunity to expand their health oriented brands. Existing distribution and marketing channels give the company synergies and efficiencies that other companies can’t match.
Threats
The reliance on third party suppliers leaves the company vulnerable to disruptions outside their control (i.e. livestock diseases).
Dividend Analyzer Checklist
(updated December 2016)
Dividend Safety Score (27/33 points)
Dividend Per Share (ttm): $0.58
Dividend Payout Ratio (ttm): 33%
Dividend Per Share (10 Year Growth): 15.3%
Cash From Operations (CFO) Per Share (ttm): $1.83
CFO Dividend Coverage (CFO / DPS): 3.2 (3/6 points)
Free Cash Flow (FCF) Per Share (ttm): 1.37
FCF Dividend Coverage (FCF / DPS): 2.4 (4/6 points)
Net Financial Debt: -165 M
Total Assets: $6370 M
Net Financial Debt / Total Assets: -3% (11/12 points)
Net Financial Debt to EBITDA (ttm): 22%
Total Liabilities to Assets Ratio (Qtr.): 30%
Piotroski Score (1-9) (TTM): (9/9 points)
Profitability & Growth Score (25/33 points)
Revenue (10 Year Growth) *CAGR > 4.14%: 5.2% (4/4 points)
EPS Basic Cont. Operations (10 Year Growth) CAGR > 4.14%: 12.4% (4/4 points)
Cash From Operations (10 Year Growth) CAGR > 4.14%: 7.3% (6/6 points)
Operating Earnings Yield (ttm): 7.3% (3/7 points)
Net Income (ttm): $890 M
Gross Profit (ttm): $2158 M
Total Assets: 6370 M
Gross Profitability Ratio = GP / Total Assets: 34% (8/12 points)
Cash Return On Invested Capital (CROIC)(tttm): 16%
Return on Invested Capital (ROIC): 19%
Return on Invested Capital (ROIC) (5 Year Median): 16%
Return on Invested Capital (ROIC) (10 Year Median): 16%
Valuation Score (15/34 points)
Free Cash Flow Yield (ttm): 4.1% (5/9 points)
EV to EBIT (ttm): 13.1 (5/9 points)
EV to EBITDA (ttm): 11.9 (5/9 points)
PE10: 46.5 (0/7 points)
Price to Sales Ratio (ttm): 1.9
Price to Book Value (ttm): 4.0
Price to Earnings Ratio (P/E) (ttm): 20.3
TOTAL POINTS – (67/100) (49 is an average score)
*Compound Annual Growth Rate (CAGR)
**A Compound Annual Growth Rate of 4.14% = a 50% gain over 10 years.
Dividend Value Builder Newsletter Membership (24 Issues) - $129/Yr.
Conclusion
(updated December 2016)
Type of Investor / Recommendation
Large Diversified Dividend Portfolios / Should Be Considered
Looking For Exposure to Consumer Defensive Sector / Should Be Considered
Looking For Dividend Kings & Aristocrats / Good Choice
Deep Value Investors / Watchlist
Hormel Foods (HRL) is ranked #31 (out of 245) overall and #8 (out of 32) in the Consumer Defensive sector by the Dividend Analyzer. HRL is well above average in Dividend Safety and Profitability & Growth, but has a valuation that more than reflects much of those positive attributes.
Additional Analysis: Hormel Foods from Sure Dividend
Portfolio Position Disclosures:
DVB Foundation Portfolio – None
DVB Dividend Growth – None
DVB High Income – None
Arbor Asset Allocation Model Portfolio (AAAMP) – None
Discover, Evaluate, and Compare Dividend Stocks
Dividend Safety, Profitability & Growth, and Valuation Scores. 100 Highest Ranking Dividend Stocks, Best Stocks For Each Sector. 3 DVB Portfolios! Lock-in the Dividend Value Builder Newsletter for $9.99/month or $99/year. Free 10-Day Trial. You take NO risk. Start today!
Disclaimer:
While Arbor Investment Planner has used reasonable efforts to obtain information from reliable sources, we make no representations or warranties as to the accuracy, reliability, or completeness of third-party information presented herein. The sole purpose of this analysis is information. Nothing presented herein is, or is intended to constitute investment advice. Consult your financial advisor before making investment decisions.
