Dividend Value Builder Newsletter
- Discover, Compare, and Evaluate Stocks & ETFs Without Emotional Bias -
PepsiCo (PEP) Dividend Stock Analysis
PepsiCo Dividend
Sector: Consumer Defensive
Industry: Beverage – Non Alcoholic
The PepsiCo dividend has been paid every year since 1952 and increased for 53 consecutive years; qualifying the company for the prestigious Dividend King List.
Current Dividend Annualized: $5.69
Why You Might Want to Own the Company:
PepsiCo offers defensive stability and consistent income through its reliable dividend and resilient demand across economic cycles. Its global scale, leading brands, and ability to adapt to consumer trends provide a solid foundation for steady growth. For investors seeking a blue-chip consumer staples company with both income and moderate long-term appreciation potential, PepsiCo presents an appealing choice.
Is the stock price a Buy, Sell, or Hold?
Pepsi (PEP) Intrinsic Value & Margin of Safety Analysis
(updated February 2026)
Normalized Diluted Earnings Per Share (TTM): $6.00
Free Cash Flow Per Share (TTM): $5.59
Cash Flow From Operations Per Share (TTM): $8.80
Estimated Intrinsic Value: $150
Target Buy Price Based on Required Margin of Safety = $127
(Required Margin of Safety Based On Risk Stability Grade:
A = 0%, B = 20%, C = 40%, D = 60%, F = 80%)
Target SELL Price Based on Estimated Intrinsic Value = $190
(Allow Overvaluation Adjusted by Risk Stability Grade:
A = 40%, B = 25%, C = 15%, D = 5%, F = 0%)
Dividend Value Builder Grades
Risk / Stability Grade: B
A grade indicates a quality company with a strong balance sheet, high earnings quality, and a positive business environment. These stocks require the slimmest margin of safety within the stock universe.
B grade indicates a company with a good balance sheet, good earning quality, and a stable business environment. The margin of safety required should be greater than stocks with an A grade but less than the average stock.
C grade indicates a company with a sufficient balance sheet, at least average earnings quality, and a reasonably stable business environment. The margin of safety required is greater than A & B stocks, but less than D & F stocks.
D grade indicates a company in good standing but has issues that could affect its stability and long term risks. D rated stocks should require a large margin of safety when purchased.
F grade indicates a company with significant issues that are currently affecting its stability and long term risks. Require an extremely large margin of safety for F rated stocks when purchased.
Financial Risk Grade: B
A grade indicates an extremely low probability of a dividend cut. This rating is reserved for companies with strong balance sheets and/or excellent dividend histories.
B grade indicates a very low probability for a dividend cut.
C grade indicates a low probability for a dividend cut and/or average safety risk.
D grade indicates there are issues that should be considered concerning future dividend payments.
F grade indicates serious dividend safety risks. Investors should complete comprehensive due diligence before investing.
Business Quality Grade: B
A grade indicates earnings quality is high or far above average.
B grade indicates earnings quality is good and/or above average.
C grade indicates earnings quality is acceptable or average.
D grade indicates earnings quality is poor and requires thoughtful due diligence.
F grade indicates the quality of the earnings is poor or far below average requiring serious due diligence.
Earnings Report: 12/31/25
AAAMP Portfolios Position Disclosures:
Treasure Trove Dividend (TTD) – LONG
Global Dividend Value (GDV) – LONG
Dividend Growth & Income (DGI) – None
Global Value (GV) – LONG
Global Value Aggressive (GVA) – None
Global Conservative Income (GCI) – LONG
Global High Income (GHI) – None
Company Description
Sector: Consumer Defensive
Industry: Beverages – Soft Drinks
Company Overview:
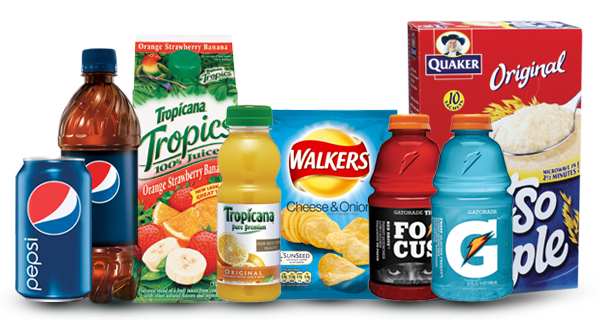
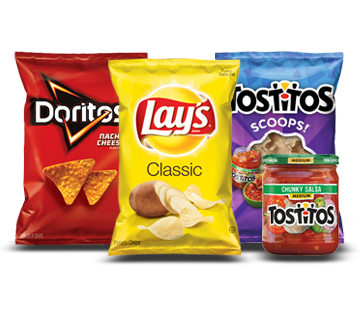
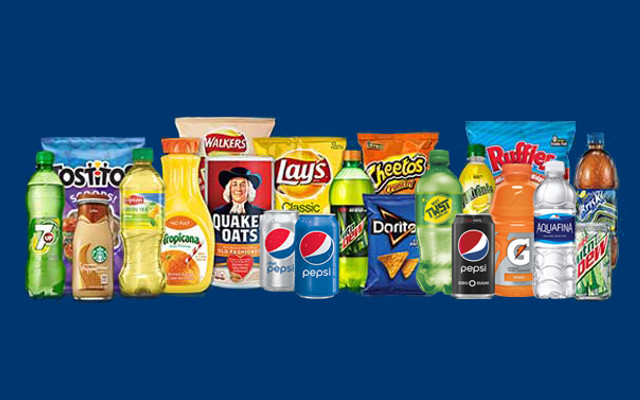
PepsiCo, Inc. (NASDAQ: PEP) is a global food and beverage company. The company operates in both the beverage and snack industries, leveraging a strong distribution network to sell its products in over 200 countries. PepsiCo’s business is divided into several segments, including Frito-Lay, PepsiCo Beverages, and Quaker Foods.
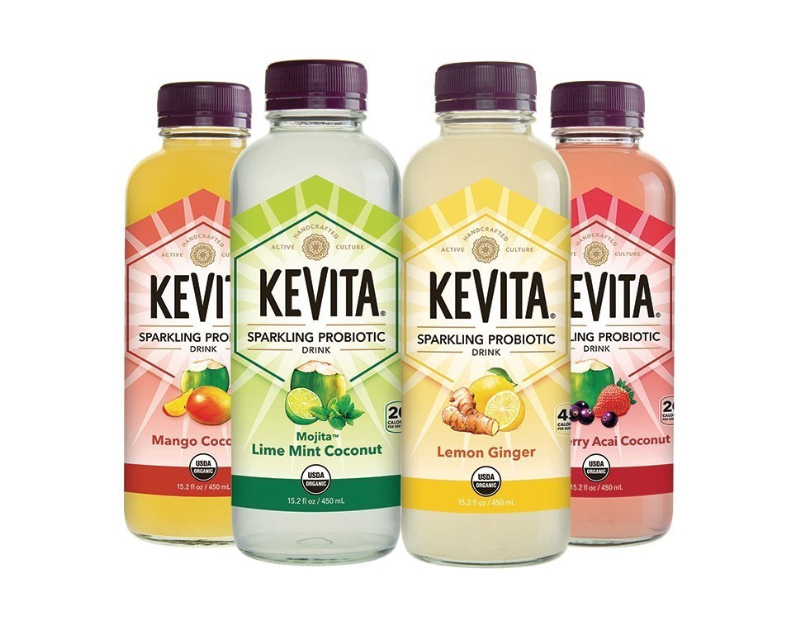
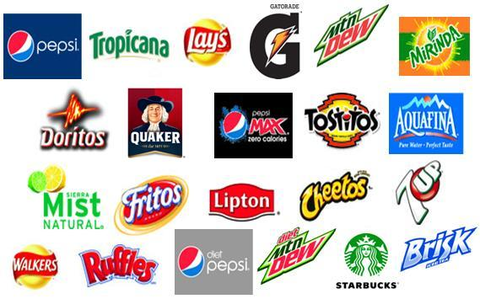
PepsiCo’s diverse portfolio includes 23 brands that each generate over $1 billion in annual retail sales. While specific revenue rankings for individual brands are not publicly disclosed, some of the top-performing brands include Pepsi, Mountain Dew, Lay’s, Gatorade, Tropicana, 7UP, Doritos, Quaker Oats, Cheetos, Mirinda, Ruffles, Aquafina, Naked, Kevita, Propel, Sobe, H2oh!, Sabra, Starbucks (ready-to-drink beverages), Pepsi Max, Tostitos, Sierra Mist, Fritos, Walkers, and Bubly.
Company Strengths:
PepsiCo benefits from a well-diversified product portfolio, reducing reliance on any single category. Its strong brand recognition, global distribution network, and marketing expertise provide a competitive edge. The company’s ability to innovate and adapt to changing consumer trends, such as healthier snacks and beverages, supports long-term growth. Additionally, PepsiCo generates strong cash flow, enabling consistent dividend payments and reinvestment in strategic growth initiatives.
Company Challenges:
PepsiCo faces challenges from shifting consumer preferences toward healthier and lower-sugar alternatives, increasing regulatory scrutiny on sugary beverages, and rising input costs due to inflation. Competition from both traditional rivals like Coca-Cola and emerging health-focused brands adds pressure. Additionally, supply chain disruptions and currency fluctuations in international markets pose risks to profitability and growth.
Dividend Value Builder Membership (24 Issues) - $199/Yr.
Minimize Large Portfolio Drawdowns
Invest With Confidence In Less Time - Manage Your Portfolio Without Behavioral Errors
Disclaimer:
While Arbor Investment Planner has used reasonable efforts to obtain information from reliable sources, we make no representations or warranties as to the accuracy, reliability, or completeness of third-party information presented herein. The sole purpose of this analysis is information. Nothing presented herein is, or is intended to constitute investment advice. Consult your financial advisor before making investment decisions.
